In Python, there are a lot of libraries that are used for data visualization. One of the libraries is the Matplotlib library. The Matplotlib library is a very good library when it comes to data visualisation in python. With the help of this library, many types of graphs and visual representations of the data can be made in Python.
While plotting graphs with the help of this library, it is always necessary to label everything on the graph and give the graph a proper title. This helps in understanding all the visualizations and graphs more efficiently.
In this tutorial, we will see how to add and modify the font of the title in Matplotlib library.
Use the matplotlib.pyplot.title() Function
The matplotlib.pyplot.title() function of the matplotlib library is used to assign the title to a given visualization or graph. This function has various parameters such as:
-
label (str)– This parameter is used to defines the text that is used for the title of the visualization. -
fontdict (dict)– This parameter is a dictionary that is used to control the appearance of the text of the title. The defaultfontdictis:123456{'fontsize': rcParams['axes.titlesize'],'fontweight' : rcParams['axes.titleweight'],'verticalalignment': 'baseline','horizontalalignment': loc} -
loc (str)– This parameter defines the place of the title. There are three places for the title,left,right, andcentre. The default value of this parameter iscentre. This is an optional parameter i.e, it is not necessary to define it in every program.
Now let’s see how to use the matplotlib.pyplot.title() function with help of some examples:
Example 1:
|
1 2 3 4 5 6 7 8 9 10 11 12 13 |
import matplotlib.pyplot as plt import numpy as np x = np.linspace(-5,5,100) y = 2*x+1 plt.plot(x, y, '-r', label='y=2x+1') plt.title('Graph of y=2x+1',fontsize = 20) plt.xlabel('x') plt.ylabel('y') plt.legend(loc='upper left', fontsize= 12) plt.grid() plt.show() |
Output:
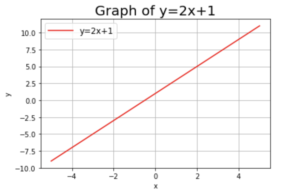
- In the above code, a straight line is plotted with the help of the formula
y=mx+c. Note that to define thexcoordinate, thelinspacefunction of theNumPymodule is used. Thelinspace()function helps in creating a random numerical sequence that are evenly spaced. - Also, note that the font sizes of the
xandylabel can also modify as per requirement
Example 2:
|
1 2 3 4 5 6 7 8 9 10 |
from matplotlib import pyplot as plt VaccineNames = ['Sputnik', 'Covaxin', 'Pfizer', 'Covi-Sheild'] Population = [30, 100, 10, 60] fig = plt.figure() ax = fig.add_axes([0, 0, 1, 1]) ax.axis('equal') ax.pie(Population, labels = VaccineNames, autopct='%1.1f%%') plt.title("Covid Vaccination", fontsize = 20) |
Output:
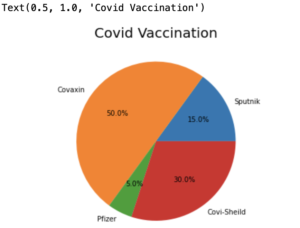
- Note that in the given code, all the different components are named with the of
labelsparameter of thepiefunction of thematplotliblibrary which is defined in the starting itself. - Finally, the title is defined with a proper font size with
centreas its defaultloc.