Table of Contents
Spectrogram
A spectrogram is a wave-like graph which is used to represent measures like loudness, frequencies, and other signals that change over time. With the help of a spectrogram, these signals and measures are visually more understandable. A spectrogram is a two-dimensional graph in which the time component is represented mostly on the x-axis.
In Python, plotting a spectrogram is a part of data visualisation and can be done using various libraries.
In this tutorial, we will see how to plot a spectrogram in Python using different dictionaries.
Plotting Spectrogram using the matplotlib.pyplot.specgram function of the Matplotlib Library.
The Matplotlib library is a very good library when it comes to data visualisation in python. With the help of this library, many types of graphs and visual representations of the data can be made in Python.
In this method, the matplotlib.pyplot.specgram function is used to plot the spectrogram. This function has various parameters. Some of them are:
x (1-D array)– This parameter defines the data of which the spectrogram has to be made.Fs (float)– This parameter helps in calculating the fourier frequencies, i.e, cycles of the samples per unit time. The default value of this parameter is2.sides– This parameter defines which sides of the whole spectrum are to be returned. Thedefaultis one-sided for real data andtwo-sidedfor complex data.onesidedforces that the spectrum returned isone-sidedandtwosidedforces two-sided spectrum.noverlap (int)– This parameter defines the number of points of overlap between the blocks in the spectrum. The default value of this parameter is128.
There are many other parameters in this function such as pad_to, NFFT, detrend, etc. Also, note that all the parameters except the x (1-D array) parameter are not necessary to define, i.e, they are optional.
Example:
|
1 2 3 4 5 6 7 8 9 10 11 |
import numpy as np import matplotlib.pyplot as plt dt=0.0001 w=2 t=np.linspace(0,5,math.ceil(5/dt)) A=30*(np.tan(5 * np.pi * t)) plt.specgram(A,Fs=1) plt.title('Spectrogram Using Matplotlib Library') plt.show() |
Output:

- The program above creates a spectrogram for the function
A=30tan(5*np.pi*t). - Note that in the program above, the
linspace()function of theNumPyis used. Thelinspace()function helps in creating a random numerical sequences that are evenly spaced.
Plotting Spectrogram using the scipy.signal.spectrogram function of the SciPy Library
Python’s SciPy library is a module that is used for tasks like linear algebra, integration, image processing, and many more. It is an open source library that helps in performing both scientific and technical computing. The SciPy library is often used along with the NumPy library.
In this method, the scipy.signal.spectrogram function is used to plot a spectrogram. This function has various parameters. Some of them are:
x (1-D array)– This parameter defines the data of which the spectrogram has to be made.Fs (float)– This parameter helps in calculating the fourier frequencies, i.e, cycles pf the samples per unit time. The default value of this parameter is1.nperseg (int)– This parameter is used to define the length of each segment. The default value of this parameter isNone.noverlap (int)– This parameter defines the number of points of overlap between the blocks in the spectrum. The default value of this parameter isNone.axis (int)– This parameter defines the axis along which the spectrogram is computed. The default value of this parameter is over the last axis, i.e,axis=-1.
There are many other parameters in this function such as nfft, scaling, detrend, etc. Also, note that all the parameters except the x (1-D array) parameter are not necessary to define, i.e, they are optional.
Example:
|
1 2 3 4 5 6 7 8 9 10 11 12 13 14 15 16 |
import math import numpy as np import matplotlib.pyplot as plt from scipy import signal dt=0.0001 w=3 t=np.linspace(0,5,math.ceil(5/dt)) A=5*(np.cos(1 * np.pi *500* t)) f, t, Sxx = signal.spectrogram(A, fs=1, nfft=510) plt.pcolormesh(t, f, Sxx) plt.ylabel('Frequency') plt.xlabel('Time') plt.title('Spectrogram Using SciPy Library') plt.show() |
Output:
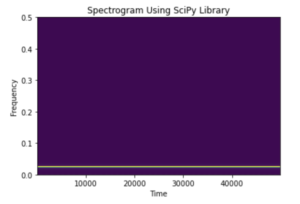
- The program creates a spectrogram for the function
A=5cos(500*np.pi*t). - Note that here also the
linspace()function of theNumPyis used. - Here, the value of the
fsparameter is set to1which will represent the sample frequency. - And the
nfftis set to510which represents the length of theFFTbeing used.
That’s all about Spectogram in Python.