Table of Contents
What is Bilinear Interpolation?
Linear Interpolation in mathematics helps curve fitting by using linear polynomials that make new data points between a specific range of a discrete set of definite data points.
The term Bilinear Interpolation is an extension to linear interpolation that performs the interpolation of functions containing two variables (for example, x and y) on a rectilinear two-dimensional grid.
This tutorial will demonstrate how to perform such Bilinear Interpolation in Python.
Creating a function to perform bilinear interpolation in Python
We can implement the logic for Bilinear Interpolation in a function. This function works for a collection of 4 points. It is a very basic implementation of the mathematical formula for Bilinear Interpolation.
See the code below.
|
1 2 3 4 5 6 7 8 9 10 11 12 13 14 15 16 17 18 19 20 21 |
def binterpolation(x, y, points): pts = sorted(points) (x1, y1, q11), (_x1, y2, q12), (x2, _y1, q21), (_x2, _y2, q22) = pts if x1 != _x1 or x2 != _x2 or y1 != _y1 or y2 != _y2: print('The given points do not form a rectangle') if not x1 <= x <= x2 or not y1 <= y <= y2: print('The (x, y) coordinates are not within the rectangle') P = (q11 * (x2 - x) * (y2 - y) + q21 * (x - x1) * (y2 - y) + q12 * (x2 - x) * (y - y1) + q22 * (x - x1) * (y - y1) ) / ((x2 - x1) * (y2 - y1) + 0.0) return P points = [(0, 1, 12), (4, 1, 0), (0, 3, -4), (4, 3, 8), ] binterpolation(1,2, points) |
Output:
Using the scipy.interpolate.interp2d() function to perform bilinear interpolation in Python
The scipy library helps perform different mathematical and scientific calculations like linear algebra, integration, and many more.
The scipy.interpolate.interp2d() function performs the interpolation over a two-dimensional grid. This method can handle more complex problems. This method represents functions containing x, y, and z, array-like values that make functions like z = f(x, y). It will return the scalar value of z.
We can use it as shown below.
|
1 2 3 |
scipy.interpolate.interp2d(x, y, z, kind='linear', copy=True, bounds_error=False, fill_value=None) |
To use this function, we need to understand the three main parameters.
x, y (array_like)– This parameter defines the data points of the coordinates. If the data points lie on a regular grid, thenxcan represent the column coordinates andycan represent therowcoordinates.z (array_like)– This parameter defines the value of the function to interpolate at the given data points.kind ('linear', 'cubic', 'quintic')– This parameter informs the kind of spline interpolation to use. The default value of this parameter islinear.
Now let us see how to perform bilinear interpolation using this method.
|
1 2 3 4 5 6 7 8 9 10 11 12 13 14 15 |
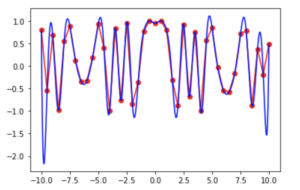
from scipy import interpolate import numpy as np import matplotlib.pyplot as plt x = np.arange(-10.01, 10.01, 0.50) y = np.arange(-10.01, 10.01, 0.50) xx, yy = np.meshgrid(x, y) z = np.cos(xx**2+yy**2) f = interpolate.interp2d(x, y, z, kind='quintic') xnew = np.arange(-10.01, 10.01, 1e-2) ynew = np.arange(-10.01, 10.01, 1e-2) znew = f(xnew, ynew) plt.plot(x, z[0, :], 'ro-', xnew, znew[0, :], 'b-') plt.show() |
Output:

In the above code,
- The
numpy.arange()function returns evenly spaced values within a given interval. This function takes the values in the form of an array. - The
numpy.meshgrid()function creates a rectangular grid with the help of one-dimensional arrays that represent cartesian indexing or matrix indexing. - Finally, the
cos()function of thenumpylibrary helps in finding the cosine value. We use this as the main function in the above code, i.e.,z.


